Below are 8 sample screen shots taken with a DSLR camera of
moving DisplayMate Multimedia with Motion Bitmaps Edition
test patterns and test photos for a
top-of-the-line 52 inch LCD HDTV from a top tier manufacturer.
All screen shots were taken with a shutter speed of
1/150th second, which is less than the refresh cycle time.
These screen shots objectively measure the LCD display's own
hardware blur, artifacts, and response time,
and are consistent with what a human
observer actually sees with these moving images.
The eye's sense of motion blur also depends on visual processing in the brain.
The images below are a sample of the 25 DisplayMate motion test patterns
and 35 test photos that are the easiest to interpret and discuss.
Not included for this reason are any of the
12 DisplayMate color motion test patterns.
Note that ALL display technologies show motion related artifacts.
We used a moderate motion speed of 1000 pixels per second.
At that speed it takes two seconds to cross the 1920x1080 screen width.
Objects frequently move much faster than that in real video.
With camera panning the entire screen image will move at
considerably faster speeds.
HDTV Refresh Rate: 120 Hz
Manufacturer's specified Response Time: 8 ms.
See the Technical Note at the bottom of the page.
For the DisplayMate test patterns shown below a live view by eye clearly
detects a blur out to at least 60 ms for the black trails and somewhat less
for the white trails.
The screen shot photos below are not quite as sensitive.
But in all of the screen shots it is possible to make out at least 8
individual refresh cycles, each offset from the other by 1/120th second.
Since the blur trails decay smoothly, all definitions of Response Time,
whether visual or instrumented, are
ad hoc.
The screen shots are marked with the indicated times.
DisplayMate measures the actual motion speed and displays it real-time at
the bottom of the screen.
The White Tips seen on edges and fine detail in all of the moving test patterns
are image artifacts resulting from high frequency signal processing
for improving the response time.
The Dark Outer Edges seen on the screen shots are due to the response time
lag in transitioning from a surrounding black background (not shown) to
the gray background.
The dark trails appear more visually pronounced here than the bright trails
because, while the LCD device response is linear,
the eye's visual sensation is based on a logarithmic ratio response.
|
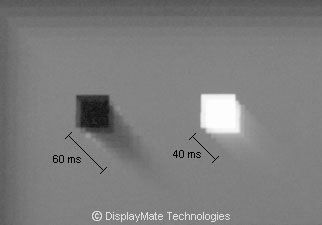 Black and White Blocks on Gray Background
Diagonal Motion
Measured H and V Speed: 1093 pixels per second
|
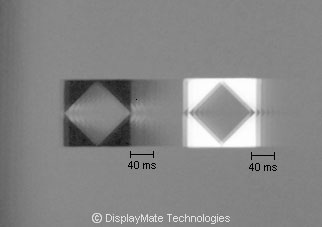 Black and White Diamond Blocks on Gray Background
Horizontal Motion
Measured H Speed: 1083 pixels per second
|
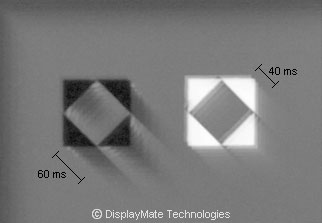 Black and White Diamond Blocks on Gray Background
Low Speed Diagonal Motion
Measured H and V Speed: 820 pixels per second
|
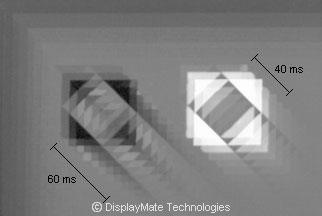

 Black and White Diamond Blocks on Gray Background
High Speed Diagonal Motion
Measured H and V Speed: 1609 pixels per second
Note that in this high motion speed screen shot the most recent frames
(upper left and right)
are clearly still developing and have not reached their final optical density.
Most of the other screen shots also show this same effect,
although it is not as obvious.
|
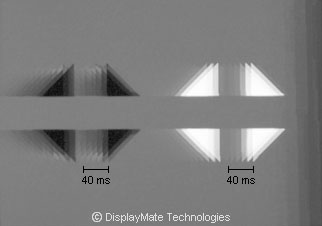 Black and White Triangular Blocks on Gray Background
Horizontal Motion
Measured H Speed: 1190 pixels per second
|
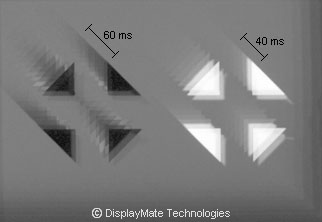 Black and White Triangular Blocks on Gray Background
Diagonal Motion
Measured H and V Speed: 991 pixels per second
|


 NASA Photo of Astronaut Barbara Morgan
Left Photo: No Motion
Right Photo: Horizontal Motion Right to Left
Measured H Speed: 1009 pixels per second
There are 4 visible superimposed images of the astronaut's face.
There are 8 visible ghost images of the astronaut's hair on the right,
and 6 visible ghost images of the flag's stars.
|


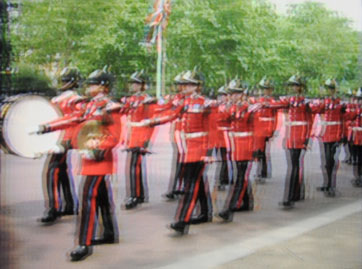
Guard Parade Photo by Lauren Soneira
Left Photo: No Motion
Right Photo: Horizontal Motion Right to Left
Measured H Speed: 1018 pixels per second
There are 5 visible ghost images of the black pants.
There are 4 visible superimposed images of the red uniforms and red pants stripes.
|
Technical Note: Response Time Specification
The industry standard Response Time specification indicates the time
that it takes for a pixel to go from black to peak white and then
back to black again.
However, most picture transitions involve much smaller and more subtle
intensity (gray-to-gray) transitions, which take much longer to complete
because the difference in electric fields are much smaller.
This effect explains why
the LCD display with the fastest Response Time specification
frequently does not have the smallest visual blur.
This also explains why the white to gray transition trails
in the above screen shots are shorter
than the closer in intensity black to gray transition trails.
|
